Viewing GIS Data in the Terminal: A CLI Tool for Remote Workflows
For busy humans
gis-view is a Rust CLI for checking raster and vector GIS data directly in a terminal, including over SSH. It avoids X11 forwarding and large file copies by rendering previews locally through terminal graphics protocols, making remote Sentinel-2 or cloud processing outputs easier to inspect quickly.
Every GIS person knows the frustration: you're SSH'd into a cloud VM or HPC cluster, you've just processed a batch of Sentinel-2 tiles, and you want to check if the output looks right. Your options? Set up X11 forwarding (slow and often broken), copy files back to your laptop (tedious for large rasters), or just trust that everything worked and move on.
A few weeks ago, GrayShade mentioned on the OSGeo Matrix channel that it would be nice
to have a tool for viewing GIS data directly in the terminal. I thought: I'd love to have that too. So I
built a quick prototype to see if it was feasible. It turned out to be easier than expected, and now we
have gis-view.
How Terminal Graphics Work
Modern terminals like Kitty, iTerm2, and WezTerm support graphics protocols that can display full-resolution images inline. The key insight is that these protocols work transparently over SSH - your local terminal interprets the escape sequences, not the remote server.
┌─────────────────┐     SSH      ┌─────────────────┐
│  Local Machine  │◄────────────►│  Remote Server  │
│  (Your laptop)  │              │  (Cloud VM)     │
├─────────────────┤              ├─────────────────┤
│  Kitty/iTerm2   │◄─ graphics ──│  gis-view       │
│  renders image  │   escapes    │  outputs data   │
└─────────────────┘              └─────────────────┘
This means you can run gis-view on a remote server and see the image rendered locally,
without any file transfer or X11 forwarding. For terminals that don't support graphics protocols, the
tool falls back to Unicode half-block characters - not as pretty, but still useful for a quick check.
What It Does
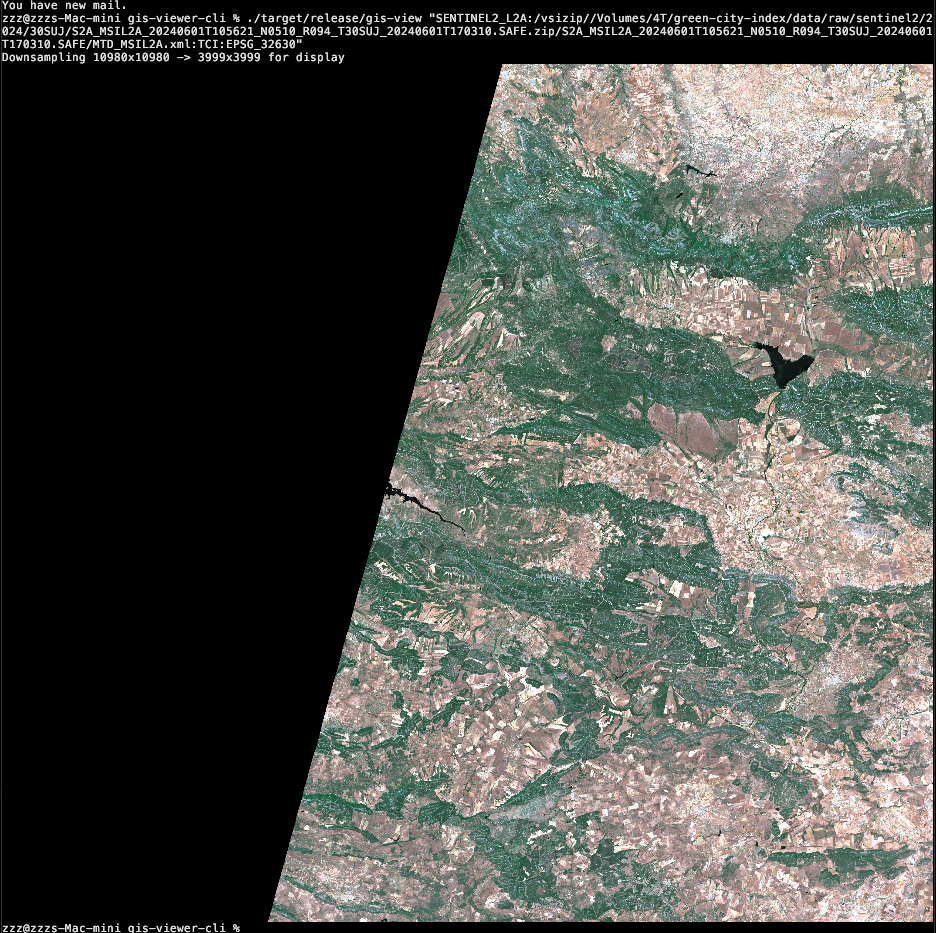
The tool reads any GDAL-supported format and renders it to your terminal:
# View a GeoTIFF
gis-view satellite.tif
# Custom band selection (NIR-Red-Green false color)
gis-view image.tif --bands 4,3,2
# Show metadata only
gis-view satellite.tif --info
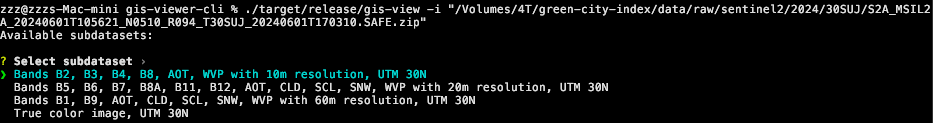
# Open Sentinel-2 directly from ZIP
gis-view -i S2A_MSIL2A_20240615.SAFE.zipThe -i flag enables interactive mode, which guides you through subdataset and band
selection. This is particularly useful for complex formats like Sentinel-2 SAFE archives, HDF, or
NetCDF files that contain multiple datasets.
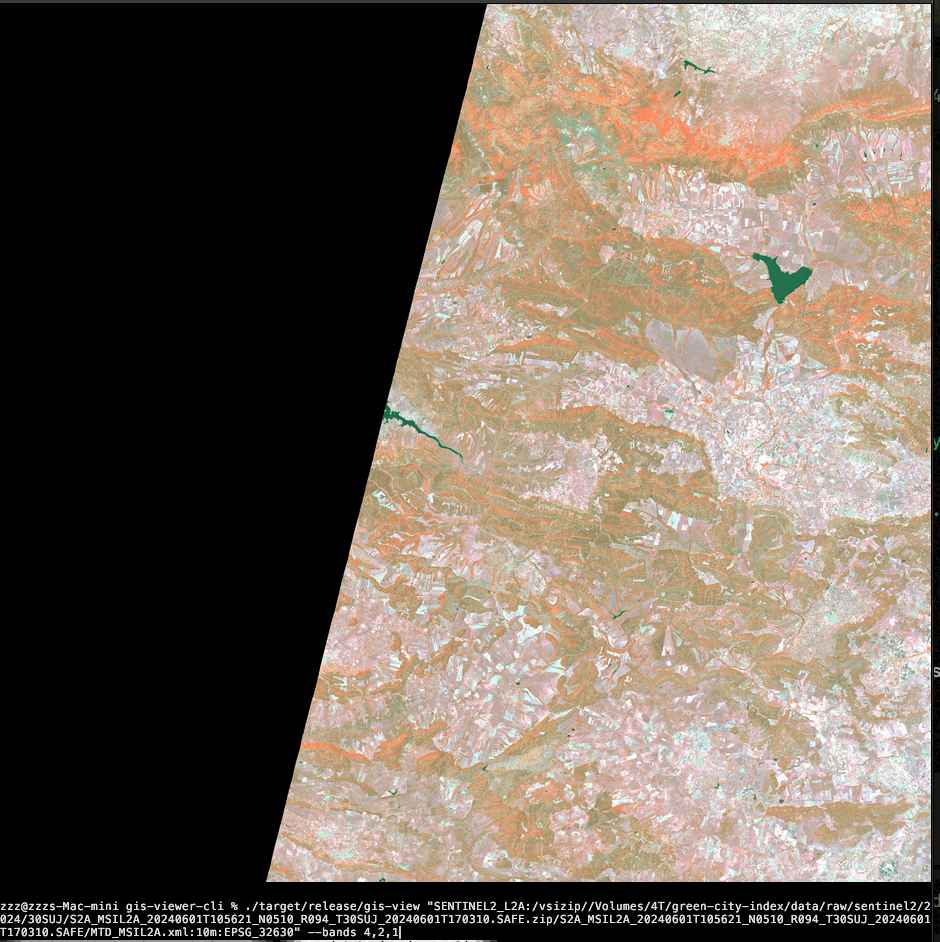
Band Composites
For multispectral imagery, band selection makes it easy to create different visualizations:
| Composite | Bands | Use Case |
|---|---|---|
| True color | --bands 3,2,1 |
Natural looking image |
| False color | --bands 4,3,2 |
Vegetation appears red/pink |
| Color infrared | --bands 4,2,1 |
NIR, Green, Blue |
| Single band | --bands 4,4,4 |
Grayscale of any band |
Vector Support
The tool also handles vector formats - GeoJSON, Shapefile, GeoPackage. It renders geometries to an image and displays them in the terminal:
# View a GeoJSON file
gis-view boundaries.geojson

# Interactive layer selection for multi-layer files
gis-view data.gpkg -i

# Show vector metadata
gis-view data.gpkg --info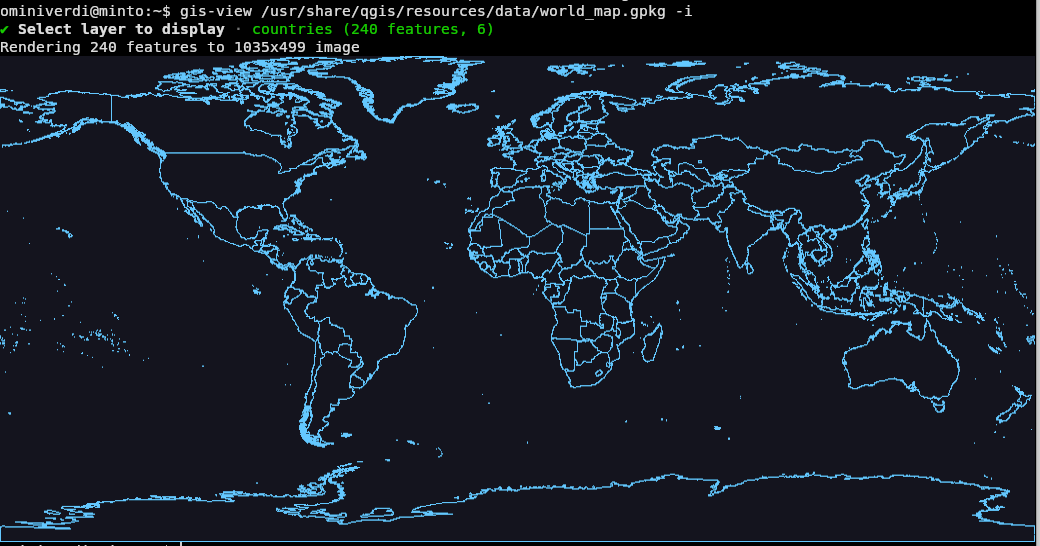
Implementation
The tool is written in Rust, using:
- gdal crate for reading raster and vector formats
- viuer for terminal graphics protocol support
- clap for CLI argument parsing
- dialoguer for interactive menus
The core rendering logic is straightforward: read bands with GDAL (which handles resampling for large rasters), apply a percentile stretch for contrast enhancement, and output via viuer which auto-detects the best graphics protocol for your terminal.
# Percentile stretch (default 2%)
# Clips the darkest and brightest 2% of pixels
gis-view image.tif --stretch 2

# More aggressive stretch for low-contrast images
gis-view image.tif --stretch 5
For large rasters, automatic downsampling prevents out-of-memory errors while still giving a useful
preview. You can control this with --max-res.
Terminal Support
| Terminal | Quality |
|---|---|
| Kitty | Full pixels (best) |
| iTerm2 | Full pixels |
| WezTerm | Full pixels |
| Others | Unicode half-blocks |
For the best experience, I recommend Kitty. It's fast, supports the full graphics protocol, and works well over SSH.
Installation
Pre-built binaries are available for macOS, Windows, and Linux (Ubuntu 22.04/24.04). GDAL must be installed on your system.
# macOS
brew install gdal
# Download binary from releases

# Ubuntu - build from source (recommended)
sudo apt install libgdal-dev
cargo install --git https://github.com/ominiverdi/gis-viewer-cli
Linux binaries are dynamically linked to GDAL, so building from source is recommended if your GDAL version doesn't match the pre-built releases.
Limitations
This tool is designed for quick previews, not detailed analysis:
- No pan/zoom - it renders a static image
- No overlays - can't combine raster and vector in one view
- tmux/screen - terminal multiplexers don't support graphics protocols well
For desktop workflows with full GUI features, vector overlays, and basemaps, check out viewtif by Keiko Nomura.
Source Code
The tool is open source under MIT license: github.com/ominiverdi/gis-viewer-cli
Acknowledgments
Thanks to GrayShade for the idea that sparked this project, and to the OSGeo community for the ongoing discussions that make tools like this possible.