Green City Index: Satellite Monitoring of Urban Vegetation Across Europe
For busy humans
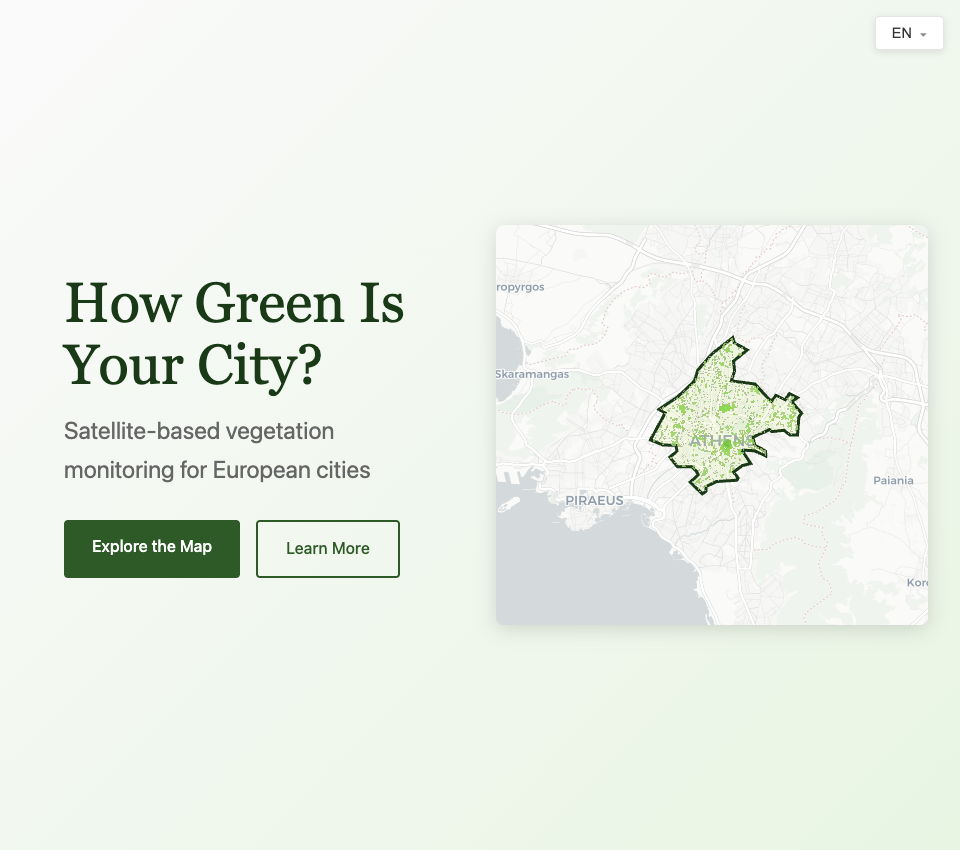
Green City Index measures how green European cities are using Sentinel-2 satellite imagery instead of park inventories. It compares 981 EU cities with the same NDVI method, showing all visible vegetation, from public parks to private gardens, and turning city greenness into open, repeatable data.
How green is your city? It's a simple question, but surprisingly hard to answer objectively. Cities often claim to offer abundant green spaces, but official statistics typically only count public parks - missing private gardens, street trees, green roofs, and all the vegetation that doesn't appear on municipal registers.
In 2016, Berlin's Morgenpost published a groundbreaking investigation that changed how I thought about this problem. Using 185 Landsat satellite images, they analyzed all 79 German cities with over 100,000 inhabitants and discovered that Siegen - not Berlin or Hamburg - was Germany's greenest city with 86% vegetation coverage. The methodology was revolutionary: measure all vegetation from space, not just what's on paper.
I wanted to build something similar for the rest of Europe, but with modern satellite data and as an ongoing monitoring system rather than a one-time snapshot.
The Technical Approach
The core idea is straightforward: download satellite imagery, calculate vegetation indices, and compare cities using the same methodology. The implementation required solving several challenges.
Higher resolution data: Sentinel-2 provides 10-meter pixels compared to Landsat's 30-meter resolution. This means we can see individual trees and small gardens that were previously invisible. For urban analysis, this resolution difference is significant.
Consistent boundaries: Comparing cities requires consistent administrative boundaries. We use GADM (Global Administrative Areas) data, supplemented with Eurostat LAU boundaries for countries where GADM lacks municipality-level detail. Each city gets a unique identifier that traces back to its source data.
Vegetation measurement: We calculate NDVI (Normalized Difference Vegetation Index) from the red and near-infrared bands. Pixels with NDVI above 0.4 are classified as vegetation. The percentage of vegetated pixels gives us a comparable "green score" for each city.
# Simplified vegetation calculation
NDVI = (NIR - RED) / (NIR + RED)
vegetation_mask = NDVI > 0.4
green_percentage = vegetation_mask.sum() / total_pixels * 100
Current Coverage
The platform currently covers 981 cities across all 27 EU member states (and growing), including all national capitals. Processing each city requires downloading satellite granules, clipping to city boundaries, generating cloud-free composites, and calculating statistics.
| Metric | Value |
|---|---|
| Cities analyzed | 981 |
| Countries covered | 27 (all EU members) |
| Total area | ~347,000 km2 |
| Satellite resolution | 10 meters |
| Years available | 2018-2025 (8 years) |
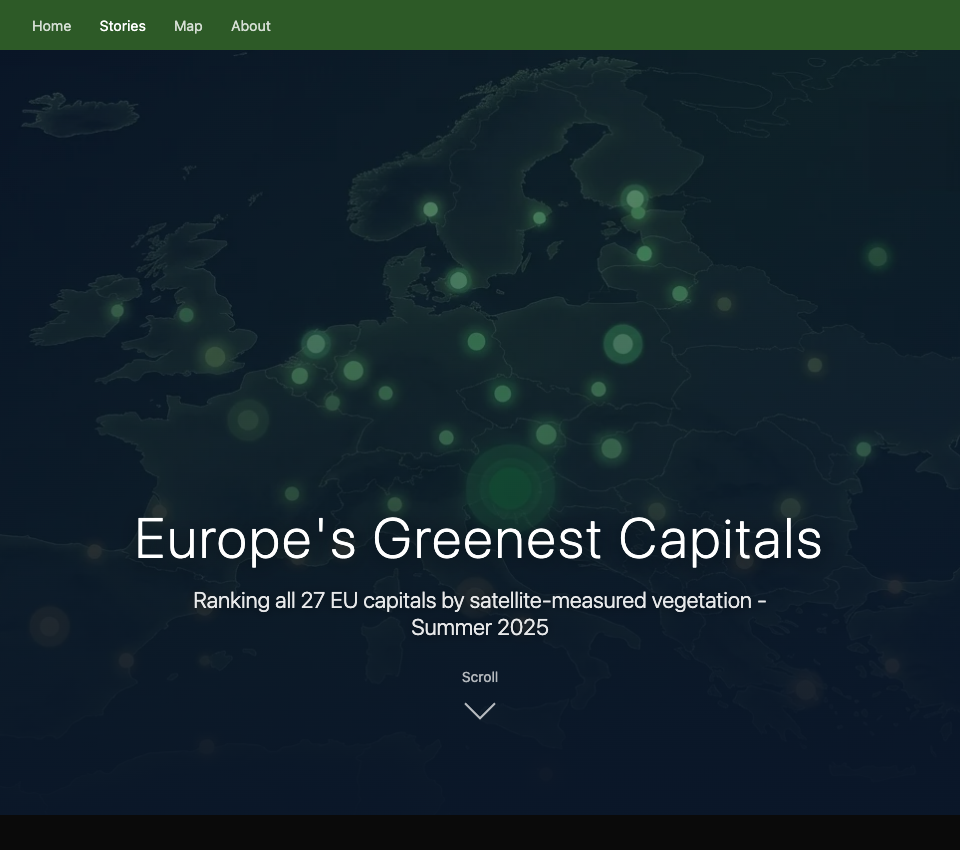
Europe's Greenest Capitals
One of the first analyses we ran was ranking all 27 EU capital cities. The results challenge some assumptions about which cities are "green":
| Rank | Capital | Vegetation % |
|---|---|---|
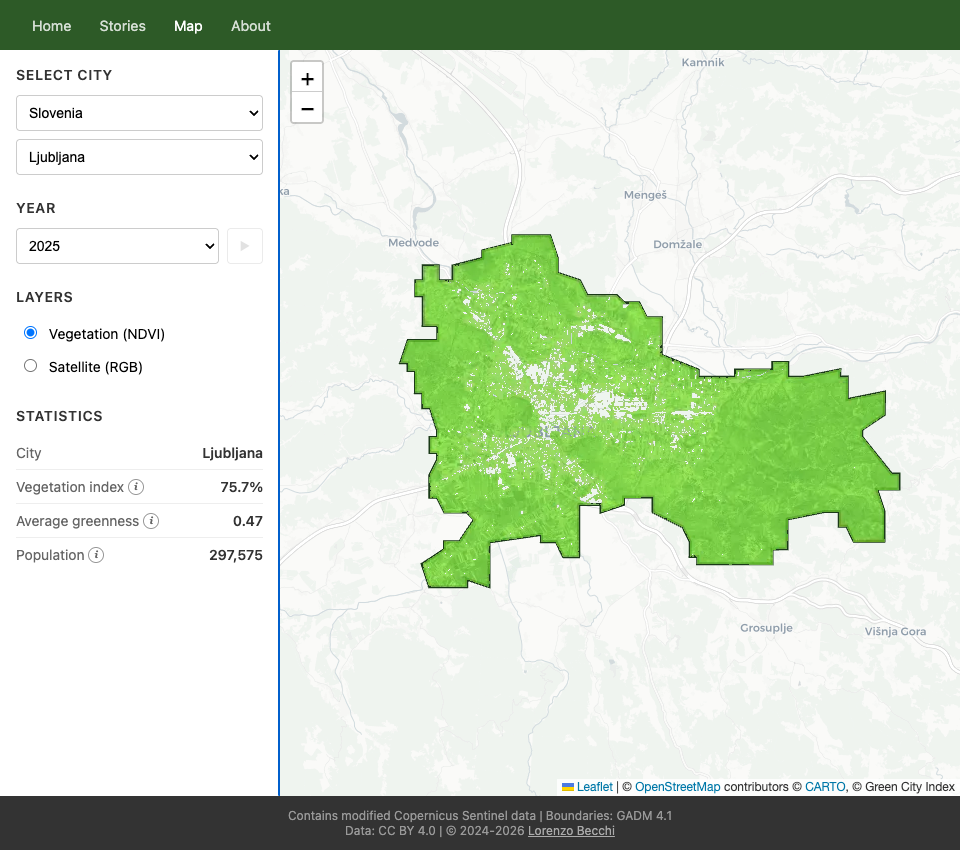
| 1 | Ljubljana, Slovenia | 75.7% |
| 2 | Zagreb, Croatia | 69.8% |
| 3 | Vilnius, Lithuania | 63.2% |
| 4 | Sofia, Bulgaria | 51.6% |
| 5 | Bratislava, Slovakia | 51.5% |
| ... | ||
| 8 | Berlin, Germany | 49.9% |
| ... | ||
| 14 | Stockholm, Sweden | 36.8% |
| ... | ||
| 20 | Copenhagen, Denmark | 29.9% |
| ... | ||
| 22 | Paris, France | 19.2% |
| ... | ||
| 24 | Madrid, Spain | 3.6% |
| 25 | Athens, Greece | 3.5% |
| 26 | Nicosia, Cyprus | 2.3% |
| 27 | Valletta, Malta | 0.2% |
Ljubljana's dominance isn't surprising given Slovenia's geography - the city sits in a basin surrounded by forests. But the data reveals patterns: the top 5 capitals are all from Central and Eastern Europe. Nordic capitals like Stockholm and Copenhagen rank 14th and 20th respectively - city boundaries matter as much as urban planning choices.
The bottom of the ranking reflects Mediterranean climate realities. Hot, dry summers and water scarcity make maintaining urban vegetation a challenge. Valletta's 0.2% is extreme but understandable - the city is essentially a fortified limestone peninsula. Madrid and Athens face similar constraints despite being much larger cities.
See the full interactive story: Europe's Greenest Capitals 2025.
The Processing Pipeline
Building a system that can process hundreds of cities across multiple years required a robust pipeline. The architecture follows a "clip-first" approach that dramatically reduces storage requirements:
# Pipeline stages (auto-discovery based on metadata status)
searched → downloaded → clipped → composited → tiled → stats → web
Each Sentinel-2 granule is ~1 GB, but we only need the pixels within city boundaries. By clipping immediately after download, we can delete the raw data and keep just the city extracts. This makes the difference between needing a data center and running everything from a desktop with an external drive.
The pipeline is written in Python, using GDAL for raster processing and my raster-calc tool for optimized NDVI calculation. Web tiles are generated at zoom levels 8-14 and served from Cloudflare R2.
Multi-language Interface
Urban vegetation is a topic that matters to citizens, not just researchers. The platform supports 25 languages (all EU official languages plus Catalan) with a static site generator that builds localized versions from Jinja2 templates.
The frontend uses Leaflet.js for mapping, with city boundaries served as PMTiles (a single-file format for vector tiles). This means the entire boundary dataset for 981 cities fits in 7.5 MB, enabling fast initial load times.
Open Data
All data outputs are licensed under CC BY 4.0. Journalists, researchers, and citizens can use, share, and build on the work with attribution.
Future Directions
With 8 years of historical data now available, planned improvements include:
- Trend analysis: Identifying cities gaining or losing green cover over time
- Thermal analysis: Correlating vegetation with land surface temperature to understand urban heat island effects
- Green accessibility: Calculating what percentage of residents live within 300m of substantial green areas
- Regional comparisons: Grouping cities by climate zone for fairer rankings
Try It
The platform is live at green-city-index.org. Search for your city, see how it compares to neighbors, and explore data stories about urban vegetation patterns across Europe.
Acknowledgments
This project was developed in collaboration with Julia Nogue, who contributed the editorial vision and contextual research. The satellite data comes from the European Space Agency's Copernicus program, and administrative boundaries from GADM and Eurostat.